
The best approach for taking into account risks when economically evaluating investment opportunities is the application of probabilistic valuation. This is a more disciplined methodology than just ‘running some sensitivities’.
And it is much to be preferred over the wide established practice of slapping on a ‘risk premium’ on top of the discount rate, thinking that the decision metrics thus derived are appropriately ‘corrected for risk’. Probabilistic valuation forces the analyst to identify the uncertainties and risks, to quantify them, to think in ranges rather than in single numbers and to present the results with their appropriate uncertainty ranges to decision makers. In this way the analyst looks ‘under the hood’ of the project and in the process develops a much better understanding of the investment opportunity in play.
The issue is often that translating the input range information to ranges in the decision metrics such as NPV can be a challenge. One can make use of decision & uncertainty trees. Although a useful concept in principle, such trees can become unwieldy when dealing with more than just a few uncertainties. Monte Carlo simulation is another option, requiring special software and skills. Although the latter method can definitely be needed for some purposes, routine application in combination with complex economic models is difficult in practice for a number of reasons.
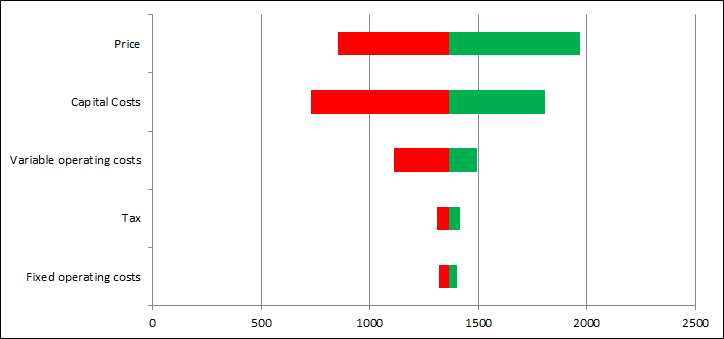
A new and simple approach is the use of an analytical solution which we have named the DeltaLogN method. Starting point is a tornado diagram, which is a representation of the impact of the input uncertainty ranges in the NPV domain. The tornado bars as in the diagram show the uncertainty ranges between the 10th and 90th percentile values. Question: can we aggregate these bars somehow to arrive at an overall NPV uncertainty range?
Yes, that is possible. By aggregating the so called moments of the tornado bars we can obtain the moments of the NPV. To put it simply, we then have obtained the mean or expectation value of the NPV, its standard deviation (a measure of the width) and the skewness. We now fit a lognormal distribution to these characteristics through solving a cubic equation. This seems a bit involved, but once it is coded in spreadsheet it becomes really very simple and quick.
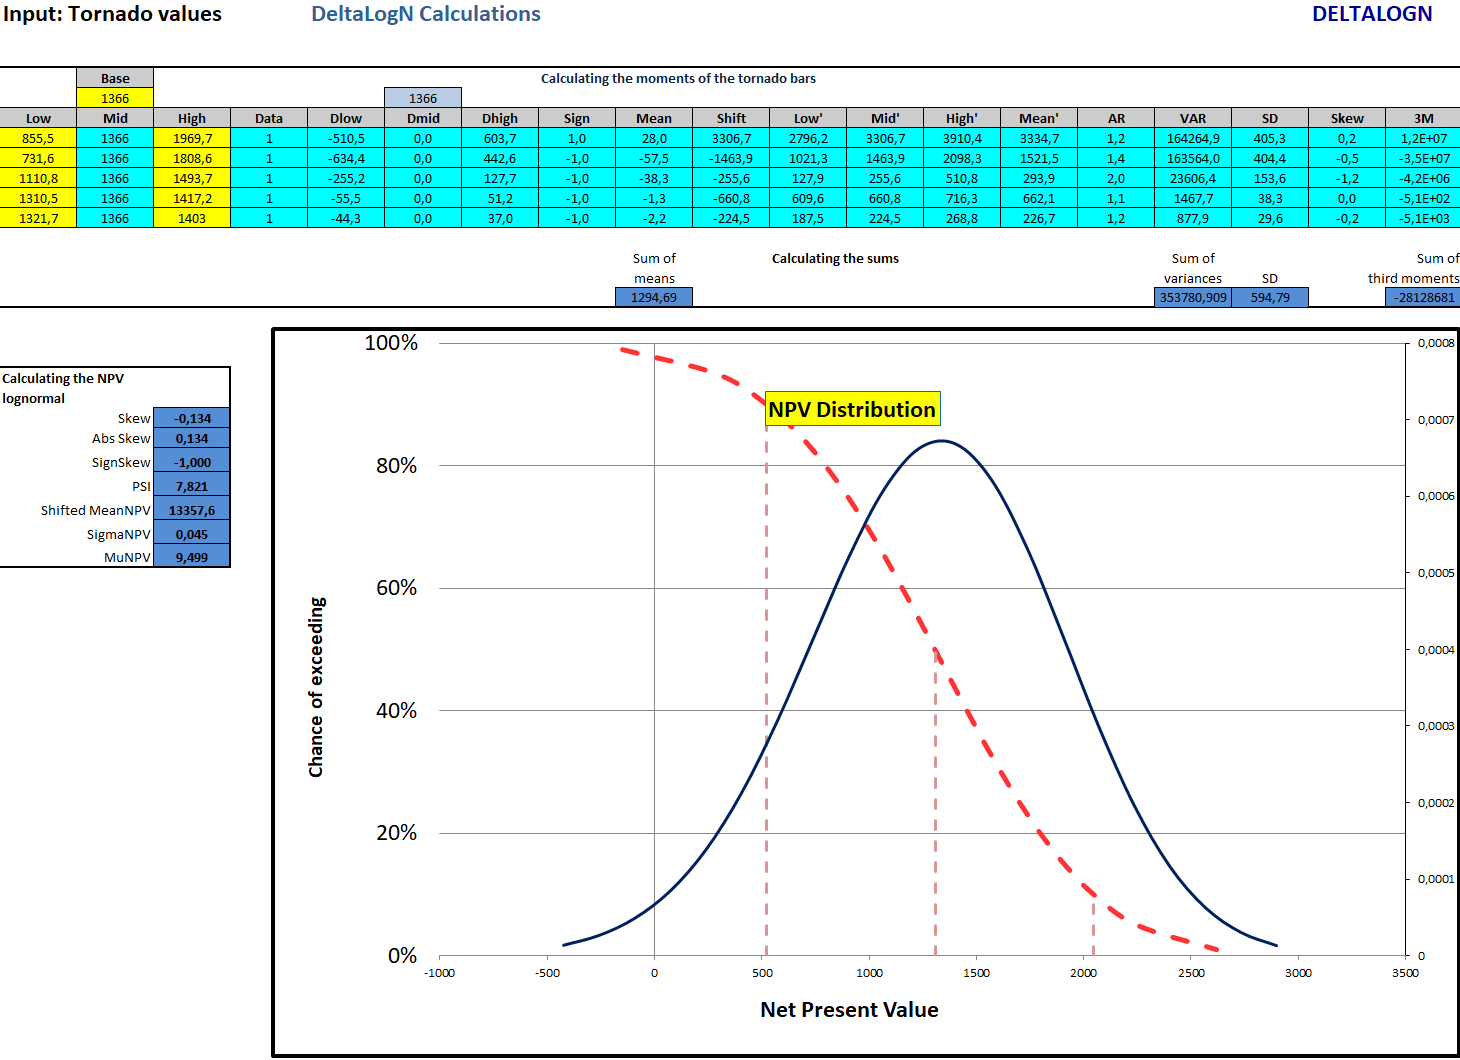
The final result is thus a lognormal distribution that quite nicely approximates the NPV distribution that would have resulted from a Monte Carlo simulation based on the economic model proper. Hence, once we have prepared a tornado for the NPV we can obtain the NPV distribution with a few cells in a simple spreadsheet. This helps a lot in understanding the risks associated with an investment project, although we assert at the same time that an NPV curve will often not capture ALL risk dimensions.
The DeltaLogN method can be used for various other purposes, such as analysing a decision tree, portfolio analysis and cost or budget risk analysis.
For more detail one is referred to the Knowledge_Base and the course Probabilistic Investment Analysis.
